Showing posts with label Google Heat Map Charts. Show all posts

Friday, November 30, 2012

Google World Heat Map (By Passing Latitude and Longitude)


If you want to create world map chart with markers by passing Latitude and Longitude of Location. Snapshot below -
Image
Steps to use
Download the working file https://www.box.com/s/hzbd6tc6l20sajj7zwel
  • Download the file
  • Go to “Data” sheet
  • Add Latitude and Longitude of locations in Col A and B.
  • Add the sales value in Col “C”. You can change the header of Sales column to “Population” ,”Market Share” , etc as per your requirement .
  • Put the HTML code of minimum and maximum color in cell “F2″ and “F3″ . List of HTML code is easily available over net or you can pick it from here http://www.w3schools.com/tags/ref_colornames.asp
  • Click on “update map” button

Google Country Level Heat Map (By Passing Latitude and Longitude)


If you want to create country level heat map chart by passing Latitude and Longitude of its cities. Snapshot below-

Image
Download working File 
Steps to use
  • Download the file
  • Go to Data sheet
  • Add Latitude and Longitude of locations in Col A and B.
  • Add country code in cell F5
  • Add the sales value in Col “C”. You can change the header of Sales column to “Population” ,”Market Share” , etc as per your requirement .
  • Put the HTML code of minimum and maximum color in cell “F2″ and “F3″ . List of HTML code is easily available over net or you can pick it from here http://www.w3schools.com/tags/ref_colornames.asp
  • Click on “update map” button

Monday, November 19, 2012

Google Heat Map charts In Excel (at Country Level)


If you want to create heat map chart using Google Map charts in Excel. Snapshot below -
USA
India
Steps to use
  • Download any of the file
  • Go to “Data” sheet
  • Choose Country in cell “B2″. Make sure code appears in cell “C2″ . This code  tells Google map which country to display. List of codes is available here https://developers.google.com/chart/interactive/docs/gallery/geochart
  • Put the HTML code of minimum and maximum color in cell “F2″ and “F3″ . List of HTML code is easily available over net or you can pick it from here http://www.w3schools.com/tags/ref_colornames.asp
  • Add the state names and the value in Col “A” and “B” from row 7 onwards .
  • You can change the header of Sales column to “Population” ,”Market Share” , etc as per your requirement . Make sure you do not change “State”. It should be spelled as state only
  • Once you add the state names and sales . Click on Update map button. Make sure spell of state mentioned should be correct else it will display error
Note (before you run the update map macro)
You can create the same map for any region / country all you need is Country code which is available  at the above link and correct spelling of States.

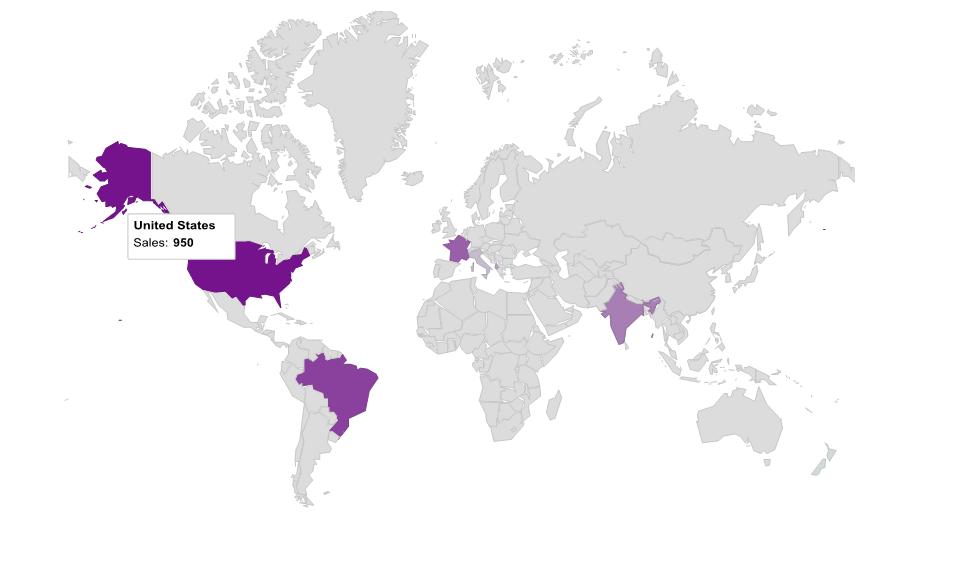
Google World Heat Map chart in Excel

If you want to create world heat map chart using Google Map charts in Excel. Snapshot below -
Image
Steps to use
  • Download the file
  • Go to “Data” sheet
  • Add country names or ISO code of country in col A. Make sure do not rename header of col “A” (Country)
  • Add the sales value in Col “B”. You can change the header of Sales column to “Population” ,”Market Share” , etc as per your requirement .
  • Put the HTML code of minimum and maximum color in cell “F2″ and “F3″ . List of HTML code is easily available over net or you can pick it from here http://www.w3schools.com/tags/ref_colornames.asp
  • Click on “update map” button
Note

Google Heat Map charts In Excel (at City Level)


If you want to create heat map chart using Google Map charts in Excel at city level. Snapshot below -
Download working File here https://www.box.com/s/ythhetfu26if1dtuamsq
Steps to use
  • Download the file
  • Go to “Data” sheet
  • Choose Country in cell “B2″. Make sure code appears in cell “C2″ . This code is tells Google map which country to show in the map. List of codes is available here https://developers.google.com/chart/interactive/docs/gallery/geochart
  • Put the HTML code of minimum and maximum color in cell “F2″ and “F3″ . List of HTML code is easily available over net or you can pick it from here http://www.w3schools.com/tags/ref_colornames.asp
  • Add city names and sales values in Col “A” and “B” row 7 onwards
  • You can change the header of Sales column to “Population” ,”Market Share” , etc as per your requirement . Make sure you do not change “City”. It should be spelled as city only
  • Click on Update map button. Make sure spell of cities mentioned should be correct else it will display error

Google World Map chart with markers in Excel


If you want to create world map chart with markers using Google Map charts in Excel. Snapshot below -
Image
Download working file here https://www.box.com/s/jy6w38my7hwgum3sw04s
  • Download the file
  • Go to “Data” sheet
  • Add country names or ISO code of country in col A. Make sure do not rename header of col “A” (Country)
  • Add the sales value in Col “B”. You can change the header of Sales column to “Population” ,”Market Share” , etc as per your requirement .
  • Put the HTML code of minimum and maximum color in cell “F2″ and “F3″ . List of HTML code is easily available over net or you can pick it from here http://www.w3schools.com/tags/ref_colornames.asp
  • Click on “update map” button
Note

Google Marker Map charts In Excel (at Country Level)


If you want to create country level map chart with markers using Google Map in Excel. Snapshot below -
India
Image

USA
Image

Download working file India https://www.box.com/s/ksyg0k4wt6600hmnuzsu
Download Working file USA https://www.box.com/s/kf4ex5yyw254clvo9t9v
Steps to use
  • Download any of the file
  • Go to “Data” sheet
  • Choose Country in cell “B2″. Make sure code appears in cell “C2″ . This code tells Google map which country to display . List of codes is available here https://developers.google.com/chart/interactive/docs/gallery/geochart
  • Put the HTML code of minimum and maximum color for markers in cell “F2″ and “F3″ . List of HTML code is easily available over net or you can pick it from here http://cloford.com/resources/colours/500col.htm
  • Add the state names and the value in Col “A” and “B” from row 7 onwards .
  • You can change the header of Sales column to “Population” ,”Market Share” , etc as per your requirement . Make sure you do not change “State”. It should be spelled as state only
  • Once you add the state names and sales . Click on Update map button. Make sure spell of state mentioned should be correct else it will display error
Note (before you run the update map macro)

Import data from SQL

Macro to import data from SQL using ADO connection string: Sub Import_data_from_SQL() ' Tools -> References -> Microsoft Active...