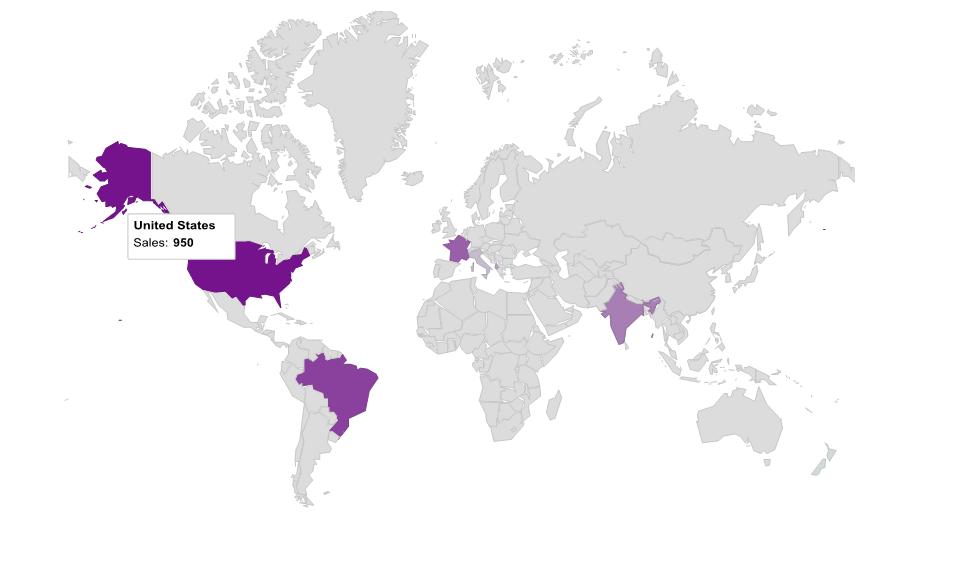
If you want to create world heat map chart using Google Map charts in Excel. Snapshot below -

Download Working file https://www.box.com/s/yxur2ea2r7cswct80hdz
To know more about it visit https://developers.google.com/chart/interactive/docs/gallery/geochart
Steps to use
- Download the file
- Go to “Data” sheet
- Add country names or ISO code of country in col A. Make sure do not rename header of col “A” (Country)
- Add the sales value in Col “B”. You can change the header of Sales column to “Population” ,”Market Share” , etc as per your requirement .
- Put the HTML code of minimum and maximum color in cell “F2″ and “F3″ . List of HTML code is easily available over net or you can pick it from here http://www.w3schools.com/tags/ref_colornames.asp
- Click on “update map” button
Note
- Make sure you type the correct spelling of country or you put the correct ISO code of country
- You can verify the ISO code here http://www.iso.org/iso/country_names_and_code_elements
To know more about it visit https://developers.google.com/chart/interactive/docs/gallery/geochart
Download Working file https://www.box.com/s/yxur2ea2r7cswct80hdz
No comments:
Post a Comment